Species & Habitat

The terraPulse Species & Habitat dataset maps the spatial distribution of the environmental niche and/or spectral characteristics of each of hundreds of species. Each map is based on available records of species abundance or occurrence and coincident values of environmental predictors drawn from the terraPulse data cube. Depending on data availability, predictive maps of habitat suitability are available at up to daily, 10-meter resolution across the entire geographic distribution of the species. Data product certainty is represented by Root Mean Square Error.

Standard Data Products

Unit: probability of occurrence given vegetation and terrain

Scale:

            Spatial: up to 10-m resolution across species’ range

             Temporal: 1984 – present

Latency: up to daily

Case Studies

Coldwell Banker uses terraPulse to monitor loss of Florida’s orange groves
The US Bureau of Land Management uses terraPulse to improve forage for mule deer and livestock
The Utah Agricultural Extension service uses terraPulse to inform ranchers statewide

Case Studies

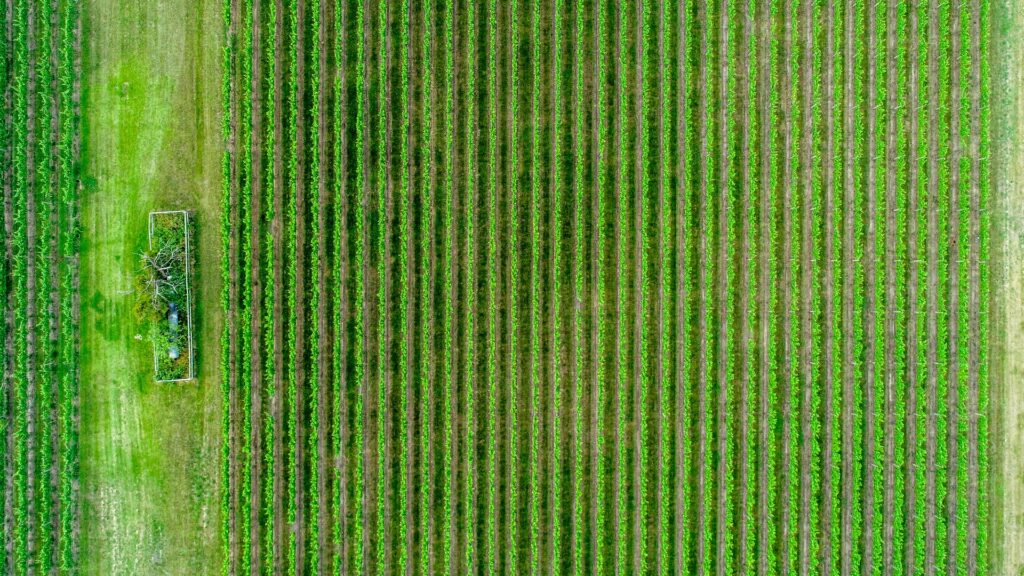
rows of crops
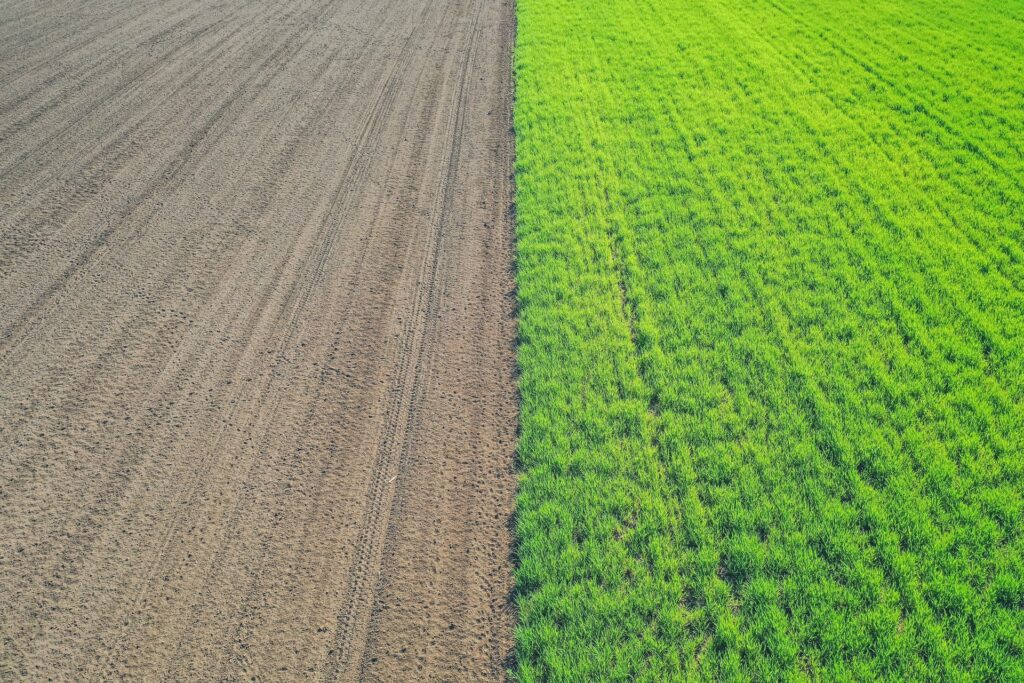
tilled agricultural soil
clear soil and
Unit:

percent of area

Scale:

Spatial: 30-m resolution, global extentextent
Temporal: annual resolution from 1984 – present

Source:

terraPulse

Latency:

previous year